Analytics
You can view statistics on quiz respondents.
Two types of data sources are available: Judge's proprietary analytics data and Google Analytics.
How to Use Judge's Proprietary Analytics Data
Judge's proprietary analytics data allows you to easily view request counts for public and shared URLs in graph format without any setup.
The Google Analytics integration feature (explained later) requires setting up a tracking code and then configuring more complex settings manually. In contrast, with Judge's proprietary analytics data, no such setup is necessary. you can easily understand the number of requests made to your created content.
During the BETA period,
paid plan users can use this feature. Free plan users cannot.
The limitations during the BETA period are as follows. *These limitations may change without notice.
: No limit
: 180 days
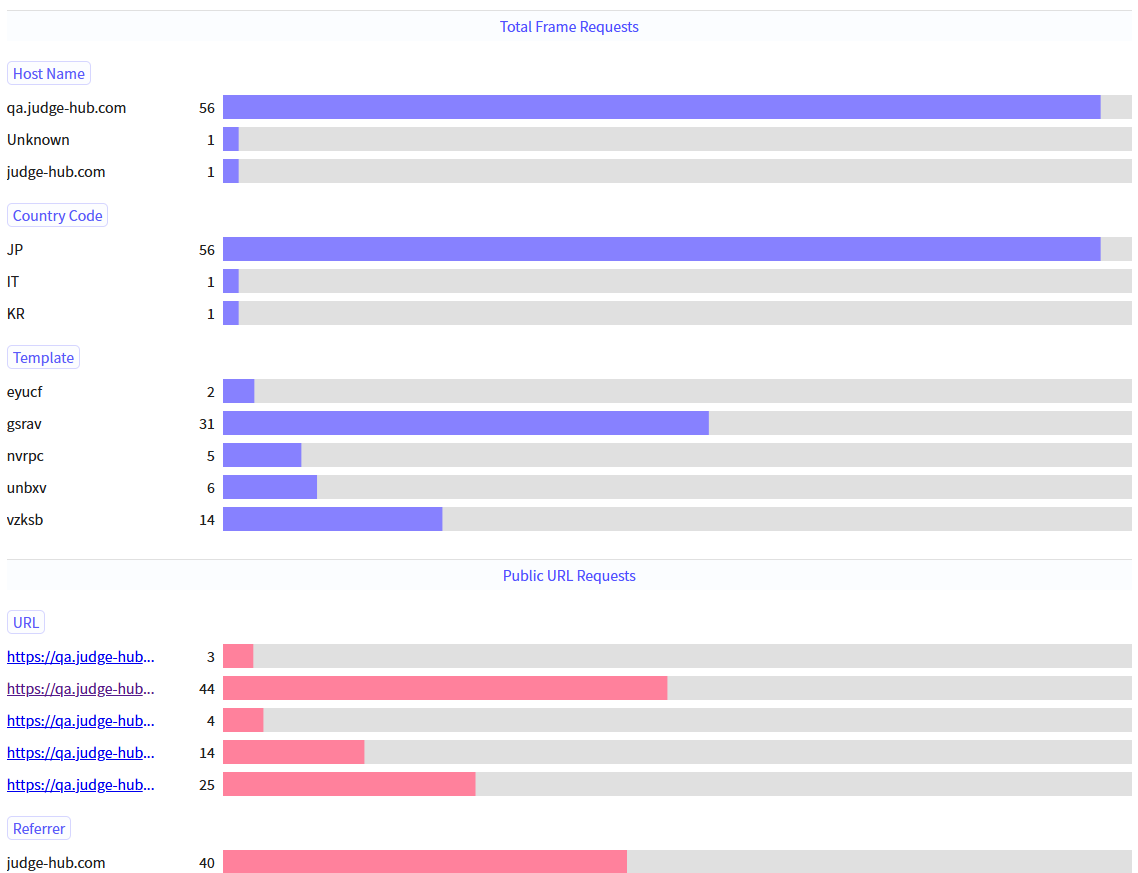
Checking Request Counts
-
Go to the > screen.
Select the content you want data for from the dropdown box and simply click the button to retrieve various request counts.
CSV downloads are also supported.
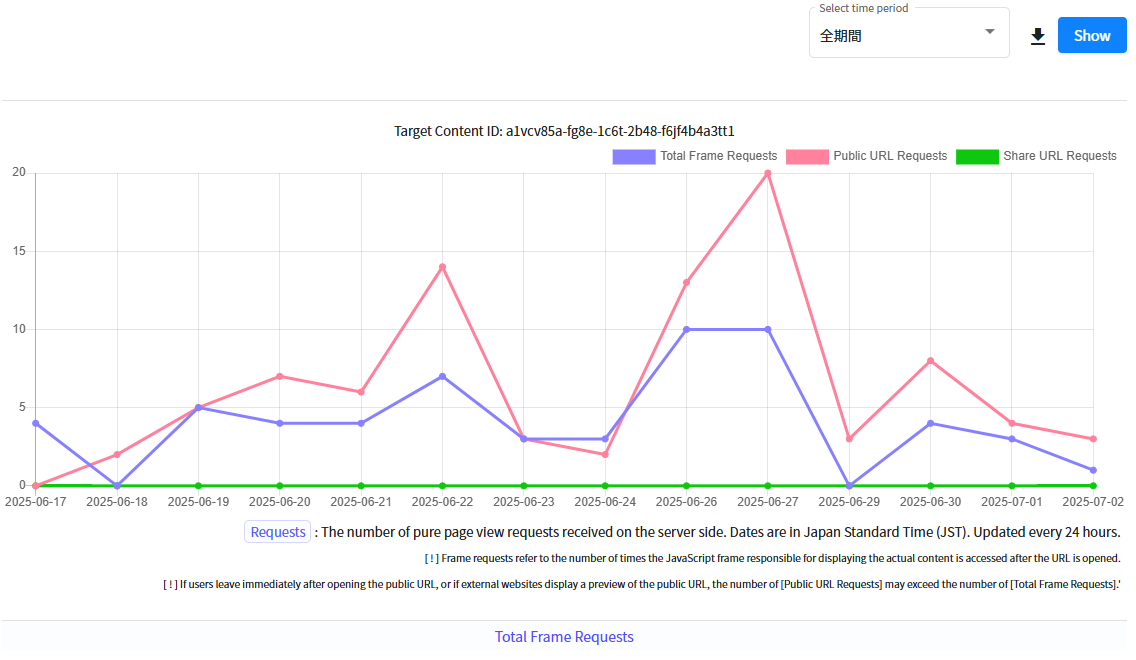
If the content is not published or has no requests, nothing will be displayed.
Request counts are based on the number of page view requests received by the server and are Judge’s own analytics data, independent of Google Analytics. If using alongside Google Analytics, please note that the numbers may not match. Google Analytics collects information by running within the browser and using cookies to identify users to some extent, which helps filter duplicate requests. However, it may not work properly in some browsers or private mode, resulting in missed counts. In contrast, Judge’s proprietary analytics simply counts all display requests to the server. While it may include duplicate requests from the same user, it has very low risk of missing counts due to browser conditions.
How to obtain statistics using Google Analytics
By setting up a tracking code for your quiz, you can link it to Google Analytics.
Getting the Tracking Code
-
Access Google Analytics, create a web data stream, and obtain the tracking code starting with "G-". For the stream URL, enter Judge's main URL such as
https://judge-hub.com.For detailed instructions, please refer to the official website.
There's no need to add tags or perform additional operations. Just obtaining the tracking code is sufficient.
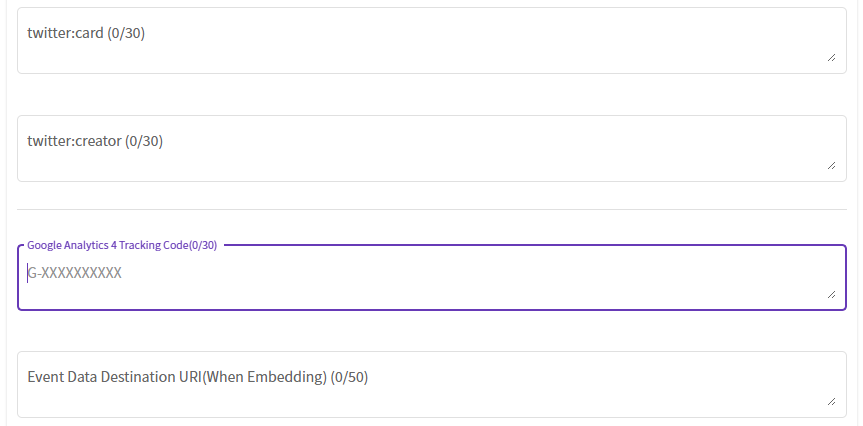
Setting Up the Tracking Code
-
Go to > screen, and click the button. Set and save the Google Analytics 4 tracking code starting with "G-". Note: This is not the older Universal Analytics tracking code starting with "UA-".
Tracking codes can be set individually for each quiz, not on a user basis.
Tracking will not occur for embedded content publication, even if the tracking code is set. By configuring settings for embedded content as described later, unique event data can be captured in the Google Analytics account of the embedding site.
Tracking will not occur in design template test mode, even if the tracking code is set.
Captured Events
- These include page views, scrolls, user attributes, and other items captured by Google Analytics' default settings.
-
In Judge, custom events such as displaying quiz results can be captured. These include content IDs, template names, the selection paths leading to quiz results, and the number of clicks on link buttons placed at the end.
* Unlike real-time data, custom event data may take several hours to a day to appear in reports.
[Steps for Embedding a Quiz]
If you embed a quiz on your own website, you can capture custom event data by following the steps below.
-
Go to > screen, and click the button. Register the embedding site's URI in the input field provided.
The URI should follow the format
https://+domain name, such ashttps://example.com.Note: This is not a
URL. Registering the URL of the embedding page will not work.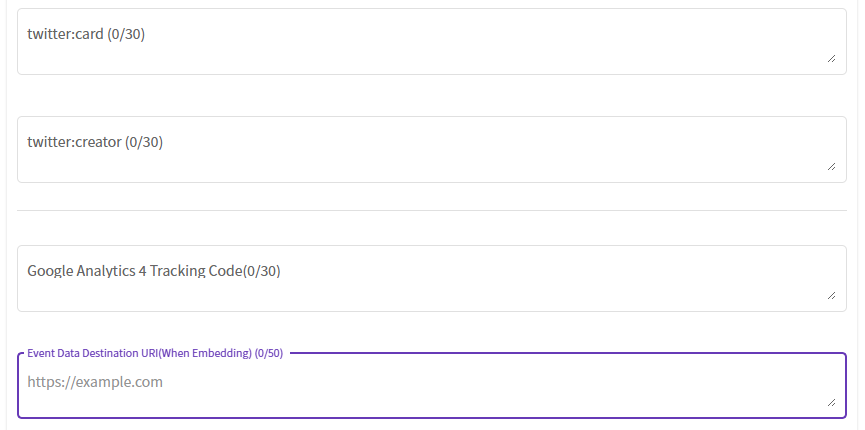
-
Next, add the following script to the
headtag of the site where the quiz will be embedded.This script allows the parent site to receive event data sent from the embedded quiz and transmit it to Google Analytics.
Ensure that the Google Analytics tracking code is already configured on the parent site beforehand.
<script>window.addEventListener('message',a=>{if('https://embed.judge-hub.com'===a.origin&&a.data&&'Judge'===a.data.event){var t=a.data;gtag('event',t.data.eventName,{items:t.data.items})}});</script>
How to Analyze Statistical Information Captured by Google Analytics
Let's visualize detailed quiz viewing statistics obtained from Google Analytics.
Verifying Tracking
-
Access Google Analytics and navigate to from the left menu. Proceed to to verify if data is being captured.
Google Analytics cannot collect data in browsers configured to block cookies, such as Firefox private windows. Use a browser like Chrome in regular mode for verification.
-
If tracking is not working, troubleshoot using the quiz below.
Analyzing Link Buttons in Quiz Results
-
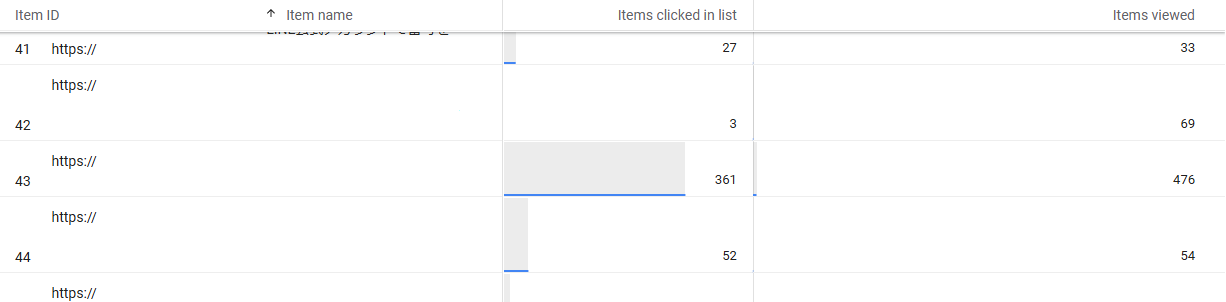
Track the view count and click count for "Link URL" buttons added to quiz results.
Access Google Analytics, select the property corresponding to the tracking code registered for the quiz. Navigate to .
Create a new exploration, add dimensions like
Item IDandItem Name, and include them in rows. Add metrics such asItem ViewedandItem Clicked in List, and register them for analysis.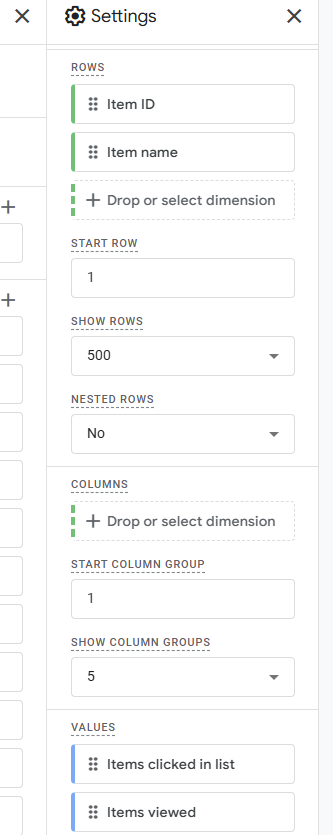
The definitions for each field are as follows:
: The URL of the link button added to quiz results.
: The name of the link button added to quiz results.
: The number of times quiz results were displayed.
: The number of clicks on the link button added to quiz results.
With these steps, you can easily understand the relationship between the view count and click count for each destination URL and link name.
Analyzing Selection Paths to Quiz Results
-
Analyze the selection paths visitors took to reach quiz results.
Access Google Analytics, select the property corresponding to the tracking code registered for the quiz. Navigate to and proceed to .
Create a new exploration, add dimensions like
Item BrandandItem Category 4, and include them in rows. Add metrics such asItem ViewedandItem Clicked in List, and register them for analysis.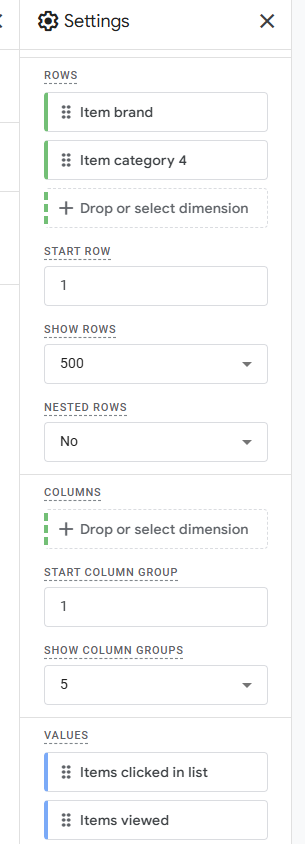
The definitions for each field are as follows:
: The content ID of the quiz. Content IDs are listed on the screen.
: Displays the selection path as a hyphen-separated string of option IDs, showing the order in which options were chosen to reach the result.
: The number of times quiz results were displayed.
: The number of clicks on link buttons added to quiz results.
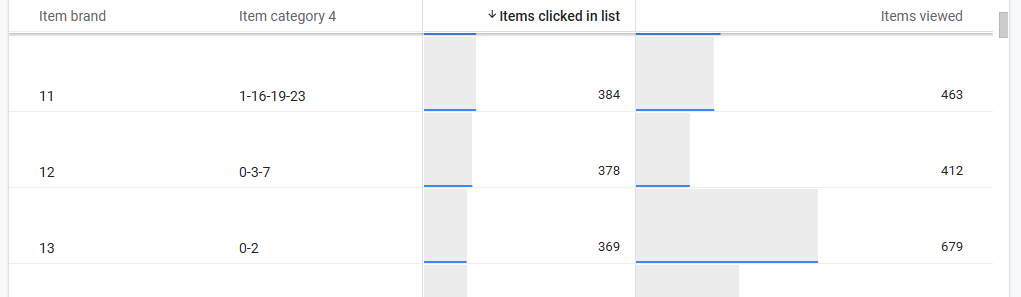
For example, in the chart above, the string
0-3-7in theItem Category 4column indicates that the visitor selected option IDs 0, 3, and 7 in that order, leading to 412 views and 378 clicks on the quiz result for that path.Next, use the flowchart feature on the screen to display option IDs.
Toggle the switch at the top of the screen to ON and switch to the flowchart view. Then, open the settings screen with the button and select from the menu.
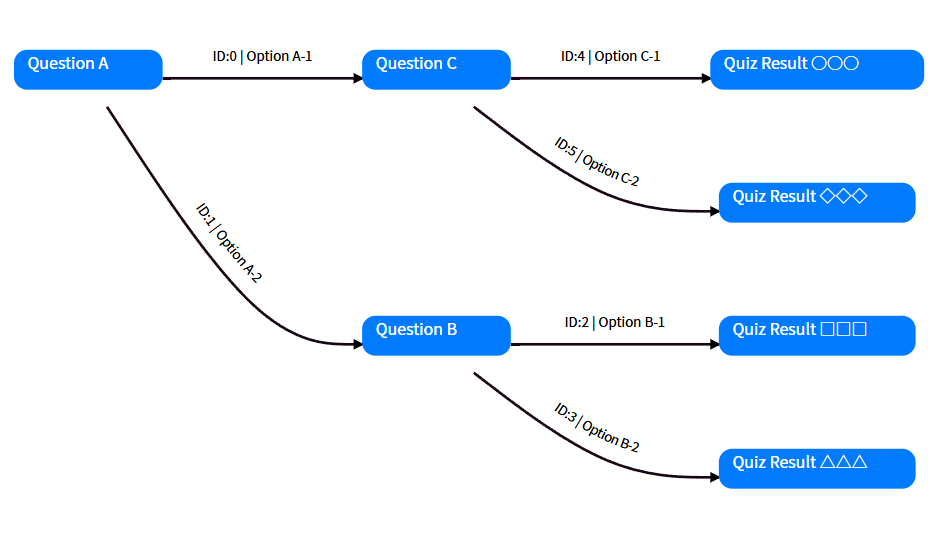
As shown above, IDs and titles are displayed on the flowchart, allowing you to compare the information displayed in Google Analytics with the flowchart to analyze which paths are most frequently chosen.