Explained with Samples
Example of Creation by Direct Connection Method
We will explain how to create a quiz using the direct connection method, using a mini-sample that assumes a personality test.
Let's check it by actually creating the same data by hand.
1. Question and Option Creation
-
Select
Question-Branching Typefor the question structure and move to the screen.from the select box, select
Connect by specifying a question/endpoint directly, and then create the data as shown below.In this example, the first question is “Are you a person who has a strong sense of compassion for others?” and there are two options, “Yes” and “No”.
If the option “Yes” is selected,
Diagnosis Result 1will be displayed as a follow-up, and if “No” is selected,Diagnosis Result 2will be displayed as a follow-up.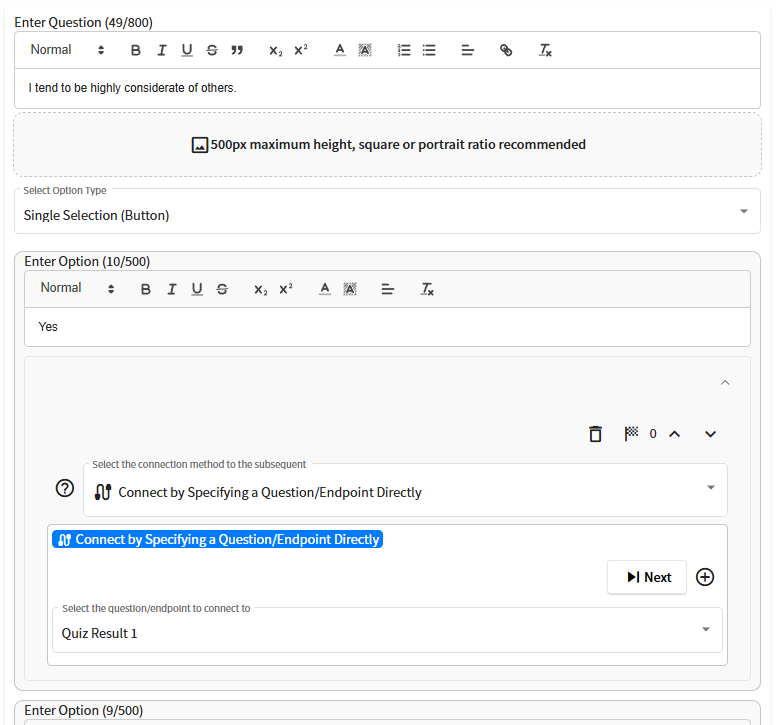
2. Check the Structure in the Flowchart
-
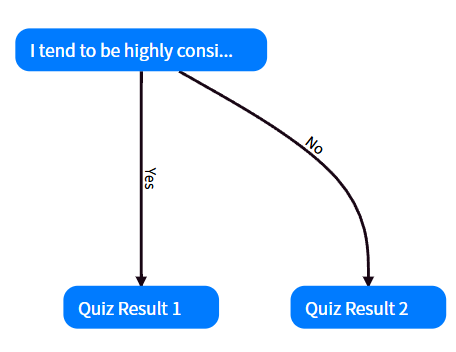
Turn on the toggle at the top of the screen to display the flowchart.
As shown in the figure below, there should be an initial question “I am a person who has a strong sense of compassion for others,” and the structure should display “Diagnostic Result 1” and “Diagnostic Result 2” directly from the options “Yes” and “No” associated with that question, respectively.
Sample Created for This Quiz
-
If you can create a quiz like the one below, you understand how to operate the direct connection method.
Template used : Stepper, Black&White, tid-grcuv
Example of Creation by Branching Rule Connection
We will explain how to create a quiz using the branch-and-rule connection method, using a mini-sample that assumes a personality test.
It requires a more advanced understanding than the direct connection method, but once understood, it is possible to create diagnostics with a more flexible structure.
Let's check it by actually creating the same data by hand.
1. Question and Option Creation
-
Select
Question-Branching Typefor the question structure and move to the screen.*This example can be created with “Question-Fixed” as well.
Select
Connect by branching rulesfrom the select box and create the data as shown below.Check here for an explanation of how to set up branching rules.
In this example, there is an initial question: "Are you someone who tends to be highly empathetic toward others?" There are two options: "Yes" and "No."
If you select "Yes,"
Extroverted: 5points will be added based on the settings in the aggregation category. According to the branching rule settings, the conditions5 <= Extroverted <= 10are met, soDiagnostic Result 1will be displayed as the outcome.On the other hand, if you select "No,"
Introverted: 5points will be added. Based on the branching rule settings, the conditions5 <= Introverted <= 10are satisfied, andDiagnostic Result 2will be displayed as the outcome.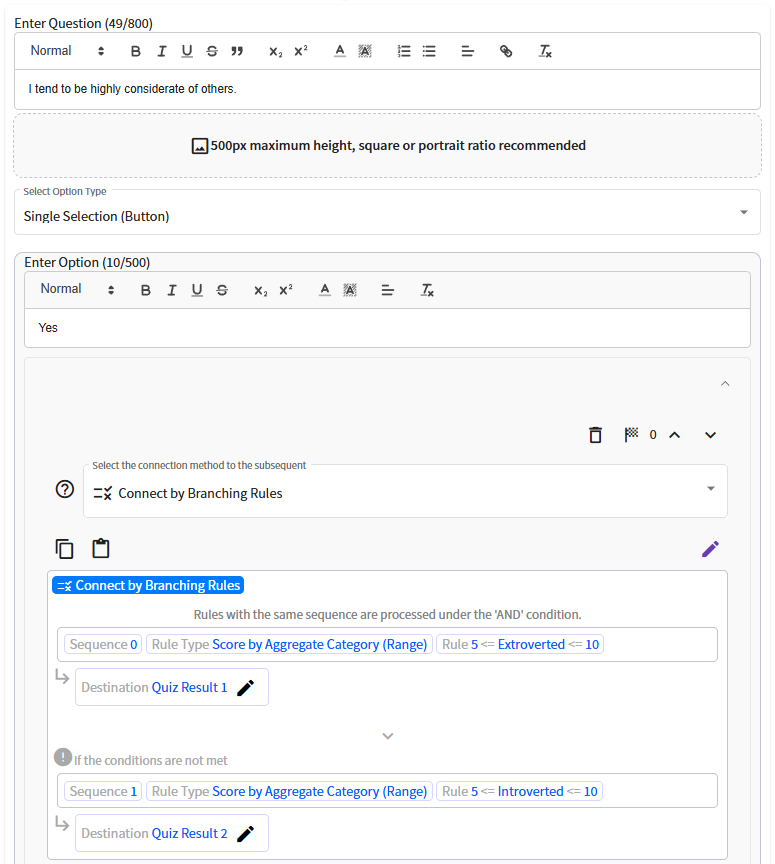
The panel requires each
Aggregation Category Nameto exactly match the corresponding aggregation category name entered in the panel. Be aware that whitespace or differences in capitalization will be treated as different aggregation category names.
2. Check the Structure with a Flowchart
-
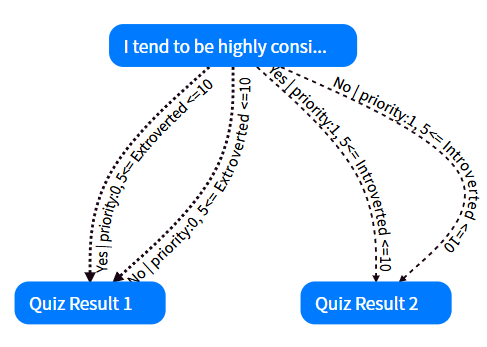
Turn on the toggle at the top of the screen to display the flowchart.
The structure shown below should appear. Compare it with the one you have created.
You can specify the items displayed as options by clicking the button. In the diagram below, the option titles and branching rules are displayed.
Sample Created This Time
-
If you have created a quiz like the one shown below, you have understood how to operate the branching rule connection method.
Template used: Stepper, Black&White, tid-grcuv
Example of Creating a Quiz Using Both Direct Connection and Branching Rule Connection
This section explains how to create a quiz using both the direct connection method and the branching rule connection method, using a mini-sample based on a personality diagnosis scenario.
Try creating the same data yourself to confirm your understanding.
1. Creating Questions and Options
-
Select the
Question-Branchingstructure and transition to the screen. Turn on the toggle at the top of the screen.※ You can also use the Question-Fixed structure for this example.
For the first question, choose from the dropdown menu and select
Directly Specify Question/Endpoint for Connection. Create data as shown below.Both options, "Yes" and "No," linked to the first question directly connect to the next question, "Do you often start something purely out of curiosity?" Selecting "Yes" adds
Extroverted: 5points, while selecting "No" addsIntroverted: 5points.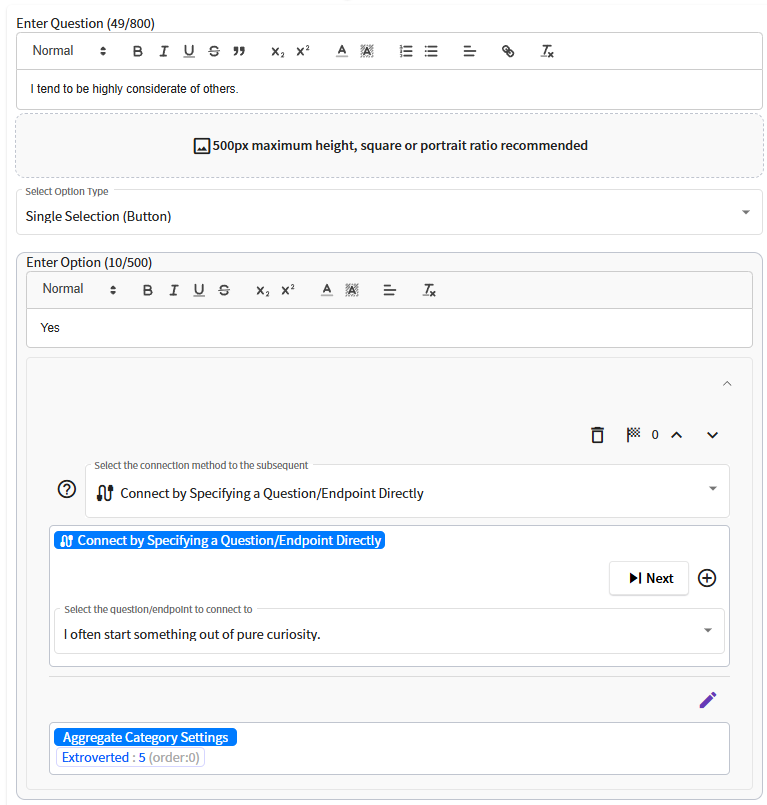
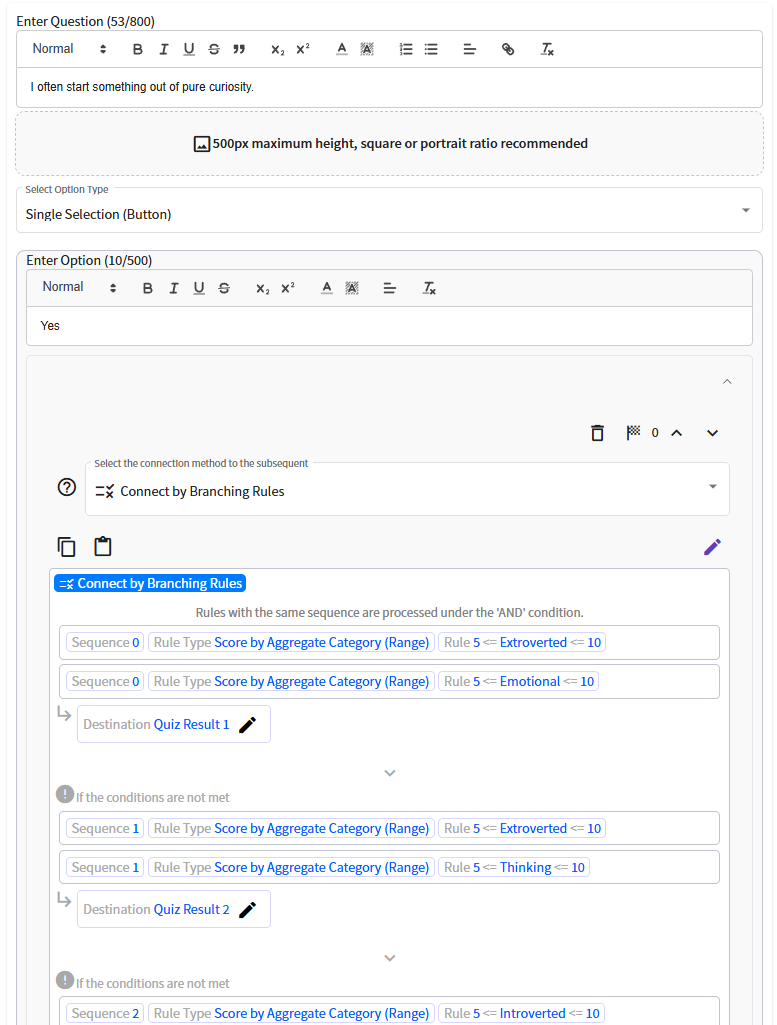
Move from the first question to the next question, "Do you often start something purely out of curiosity?"
Create data as shown in the diagram below.
Here, selecting "Yes" adds
Feeling Type: 5points to the aggregation category, while selecting "No" addsThinking Type: 5points to the aggregation category.Both options use the branching rule connection method. Depending on the choices made by the quiz viewer, the system explores matching conditions and displays "Diagnostic Result 1" to "Diagnostic Result 4."
2. Check the Structure with a Flowchart
-
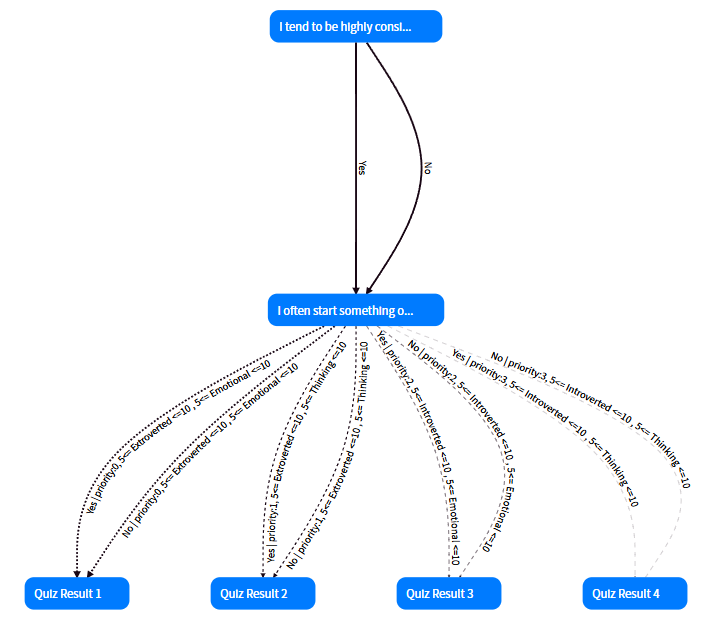
Turn on the toggle at the top of the screen to display the flowchart.
As shown below, you should be able to create a structure where the first question directly connects to the next question, leading to the same question. The branching occurs only when displaying the diagnostic results using the branching rule connection method.
Sample Created This Time
-
If you have created a quiz like the one shown below, you have understood how to operate the combined direct connection and branching rule connection methods.
※ To visualize the score distribution by aggregation category, the settings include displaying a horizontal bar chart at the endpoint. A corresponding design template is required to display aggregation graphs such as horizontal bar charts. For more details, see here.
Template used: Stepper, Black&White, tid-grcuv